

Summary Report vs. List Report
Cloudstream supports two times of reports. One is called ‘Summary Reports’, while the other is called ‘List Reports’. This section explains the differences between the two.
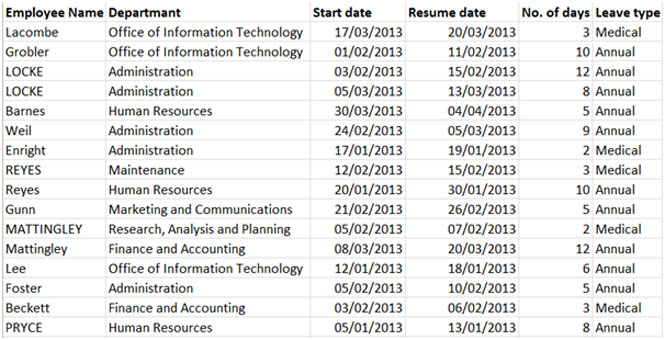
To show how these two different kinds of reports work, we’ll use an example application, in which employees of a company put forward requests for leave by filling out a form. The form collects their name, their department, the start and return days for the leave, and also calculates the total days taken.
Here is a table showing the results of 17 such requests (dates are in DAY/MONTH/YEAR):
List Report
A List Report is useful to see DETAILS of leave taken. For example, you would use a List Report to see who took vacations from each department:

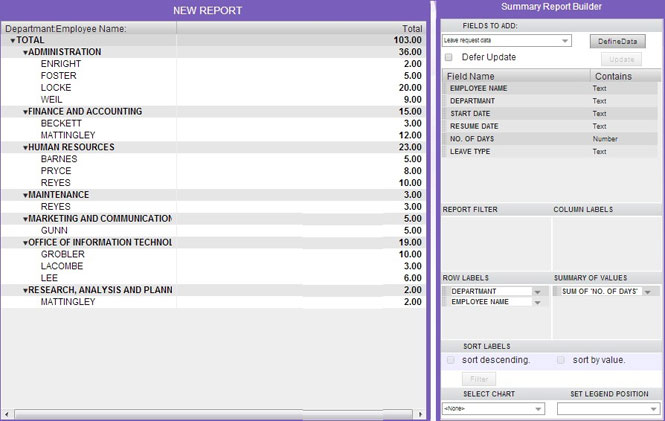
Summary Report
A Summary Report is useful to see SUMMARY of leave taken. For example, you would use a Summary Report to see how many days were taken by each person in each department:
Here are the key differences between the two kinds of reports:
| # | List Report | Summary Report |
| 1 | A list report shows all the rows of the underlying data (unless a filter is used to exclude some data). In the above example, the List Report shows all 16 rows of the sample data. (Additional rows are the category rows used to divide the data into departments). | A summary report does not show all rows of the underlying data. Instead it uses a summary of values. In the above example, the summary is the sum of leave days taken. As LOCKE had two leave requests, only the total (20 days) appears for LOCKE, and not two separate entries. |
| 2 | Columns from the underlying data appear as columns in the List report. All 6 columns in the example data have been selected in the List Report. | Columns in the Summary report are not directly connected to columns in the underlying data. Instead, they can represent an additional category to break-up the data. (In the above example, however, no column tables have been selected, so only the totals column is visible). |
| 3 | List reports don’t support charts | Summary reports can also show their data via charts. |
| 4 | List reports don’t support drill-downs | Summary reports allow the user to select a report row, and then press the button to open a drill-down window. This is a list report that shows ONLY the data that contributed to the selected row. |


