

Creating a Pivot Report
To view how to add ‘Open Report’ tile on home screen click ‘Here’
Step 1: Add a New Pivot Report
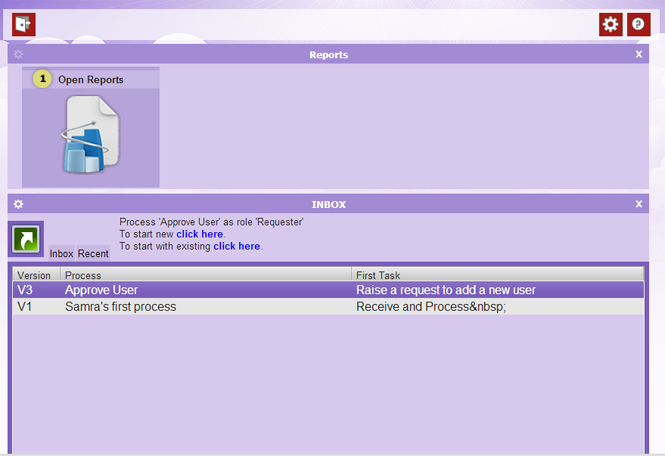
Click on your newly added ‘Open Reports’ tile (1) to open the reports section.

Click on ‘Add New Report’ (1) to proceed to Report Editor Form.

Click “No” to create a Pivot Report.
Step 2: Select Data to Analyze
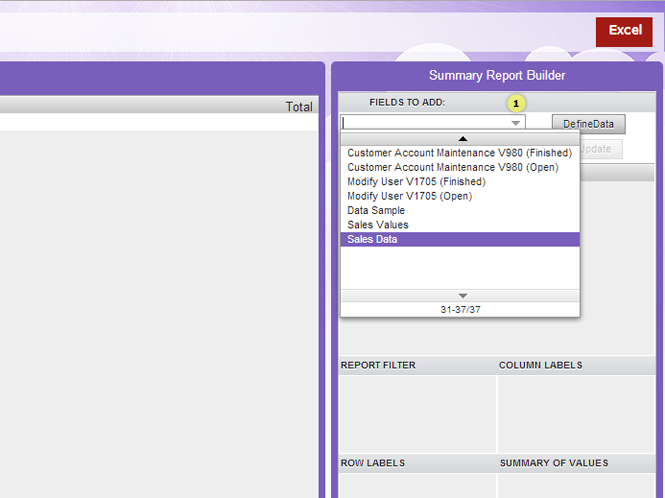
Above is the Report Editor Form. Here you can create reports and save them. Choose the data sample that you want to analyze from the drop down list (1).
Step 3: Selecting Fields to populate Report
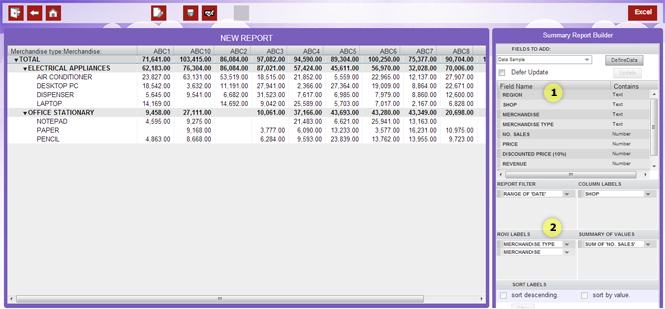
After selecting the data sample:
- Select the fields that you want appearing in your report.
- Drag fields in either of the four areas ‘REPORT FILTER’, ‘COLUMN LABELS’, ‘ROW LABELS’ and ‘SUMMARY OF VALUES’
- As you drag and place the fields to these areas, your report will start to generate and will appear on the left side.
Step 4: Adding Charts and Graphs
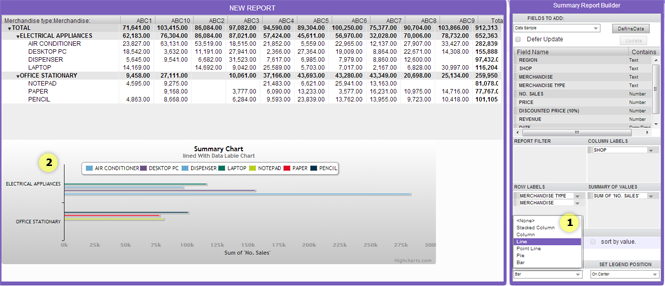
You can also add various charts and graphs in your report.
- Select the type of chart you want to add
- The chart will appear below your report
If you wish to know more about charts press here
Step 5: Naming and Saving your Report
To rename your report:
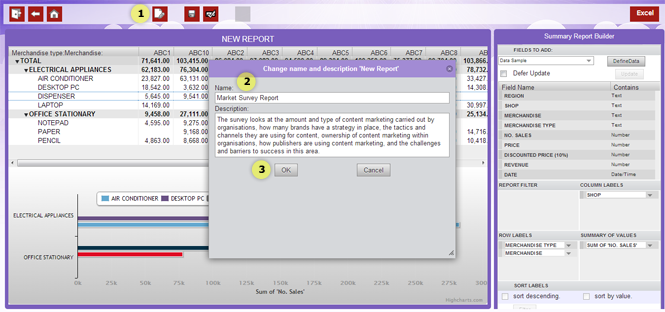
- Click the ‘Edit’ button to change your report name and description
- Enter report name and description
- Click OK to save your changes
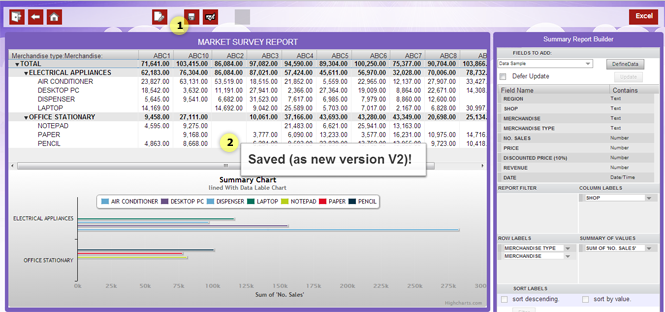
Click the ‘Save’ button (1) to save your report. A message (2) will pop up to confirm the report has been saved.
Step 6: Making a Report ‘Public’
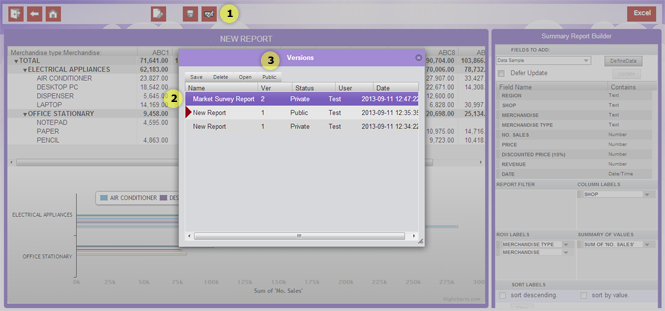
In order to make your report ‘Public':
- Click the ‘Version’ button
- Select your report name
- Click the ‘Public’ button
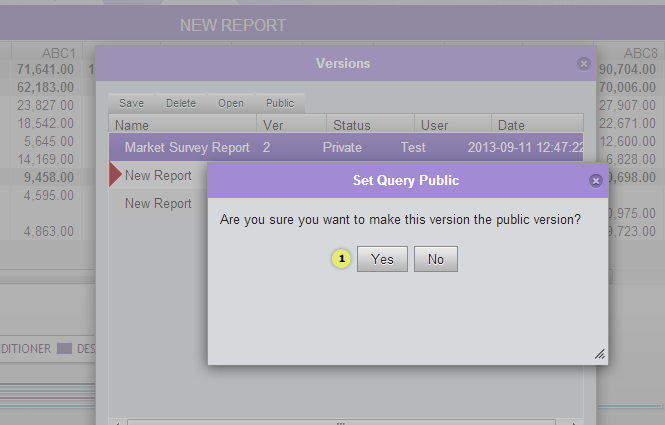
Click Yes (1) to set your report public.

Your created report will appear in the Reports section (1). You can click on it to open your report.
To make a “List” report ‘Press here’
To know the difference between “Pivot” and “List” reports ‘Press here’


